
Zimbabwe’s official year-on-year inflation for May 2021 was reported at 161,9% by the Zimbabwe National Statistics Agency (Zimstat). This was the fourth straight month of a slowdown in inflation.
Zimbabwe is enduring its second phase of high inflation, after the first peak of 500 billion percent, according to IMF figures, in September 2008. That hyperinflation phase ended when the country dollarised in 2009.
The current phase was triggered by the re-introduction of a local currency in 2019.
In the current phase, inflation reached a high of 837,5% in July 2020.
The sustained slow down in the rate of inflation since July 2020, with only one increase in January 2021, has puzzled many who wrongly interpret this to mean prices should be decreasing.
This fact sheet seeks to dispel some misconceptions about inflation.

What is inflation?
Inflation is broadly defined as the ongoing increase in the general price level of goods and services in an economy over time. It is normally reported over a period of a month and/or a year.
Year-on-year inflation compares the inflation rates for one period to the same period the previous year. The month-on-month rate compares inflation between the current month and the previous one.
What is hyperinflation?
Hyperinflation is when prices rise rapidly, by about 50% per month according to Phillip Cagan,an American monetary economist widely considered to be an expert on the matter.
In his 1956 paper, “Monetary Dynamics of Hyperinflation”, Cagan wrote: “I shall define hyperinflations as beginning in the month the rise in prices exceeds 50%.”
If inflation is declining, why are prices still rising?
Although Zimbabwe’s year-on-year inflation has been falling since July 2020, it is still among the highest inflation rates in the world. Prices are still rising, but at a slower rate compared to last year.
Zimstat uses speed to explain.
“Speed takes stock of change in distance over time, likewise inflation rate takes stock of the pace at which the general price level of goods and services changes over time. Thus, inflation could be taken as a moving object, that at one time was moving at 837.5km/hr (read 837.5% y-o-y inflation rate for July 2020),” Zimstat director general Taguma Mahonde wrote in a May 11, 2021, note.
“A braking system is then applied to this moving object (read monetary and fiscal policies that retard inflation), and the object decelerates from 837.5km/hr to 194.1krn/hr (194.1% being y-o-y rate of inflation for April 2021). Although the speed of 194.1km/hr shows deceleration from 837.5km/hr, the object is still in high speed and moving forward. The same goes for the y-o-y inflation rates which are decreasing while prices are increasing. This development is termed inflation deceleration.”
This slowdown in inflation is also called disinflation, which is often mistaken for deflation.
What is deflation?
This is a fall in the general level of prices over a sustained period of time, reflected in a negative rate of inflation. To use the speed analogy, the car would not just have slowed down, but would be in reverse gear. Economists warn that deflation is as bad as inflation because it is characterised by declining consumer spending, leading to a slowdown in economic activity and job cuts.
How does Zimstat measure inflation?
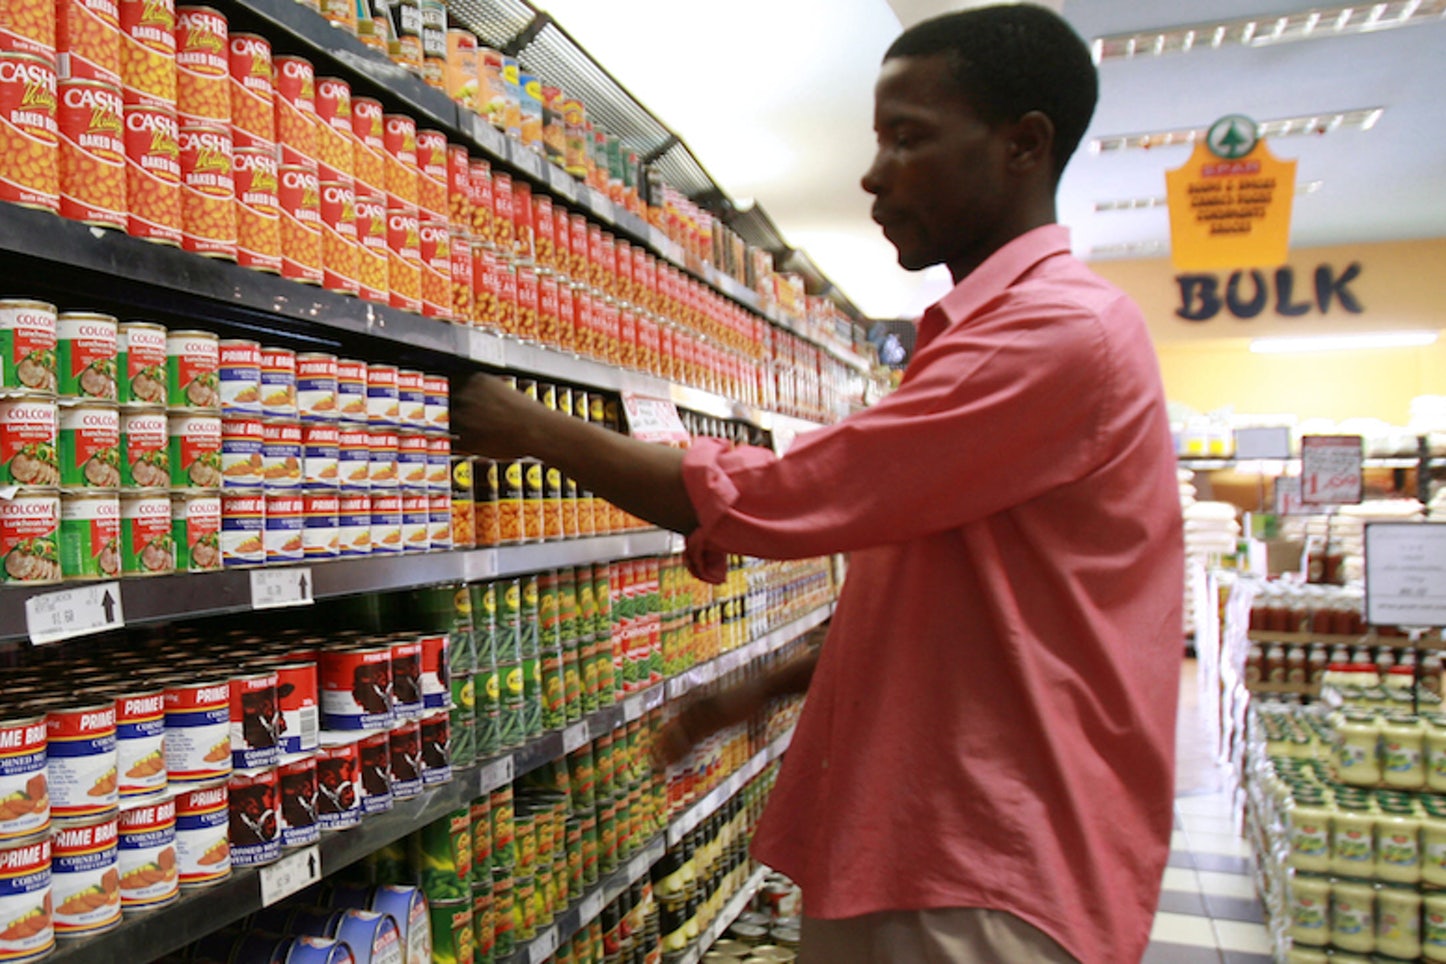
Statistical agencies, including Zimstat, collect the prices of a large number of goods and services. This makes up a basket of goods and services that reflect the items consumed by households. While the basket does not contain every good or service, it has to be a good representation of both the type and quantity of items households typically consume.
It is this basket that Zimstat uses to come up with a price index – a measure of the rice level compared to that of a specific base period. In Zimstat’s current case, the base is February 2019, when Zimbabwe formally re-introduced its currency.
Zimstat’s basket is made up of 495 products and services. About thirty-five thousand price observations are collected throughout the country within a five-day data collection period.
More than four thousand retail outlets in both rural and urban areas are surveyed throughout the country. These include supermarkets, general dealers, departmental stores, liquor stores, open markets such as the Mbare farmers market, fuel retailers, hotels and restaurants, fast food outlets, bus and taxi companies, hair salons, pharmacies, communication service providers, government and private hospitals as well as rural and urban district councils.
Price data is collected around the 15th of every month, covering about 35,000 price observations throughout the country over a five-day data collection period.
The inflation data for the month is now published on or around the 25th of that particular month.
Do you want to use our content? Click Here


. This was the fourth straight month of a slowdown in inflation. Zimbabwe…)